
Tsunami situation before disaster. Note the buildings on elevated ground and the trees to dissipate the force of the wave.

Tsunami situation after the disaster. Note that the buildings I created on the elevated plane are in tact.

Wildfire situation. Note the number of fireproof trees, the areas of cleared dried grass, and the location of the hospital next to the water.

Earthquake situation. Modern buildings were built and many of the older buildings were reinforced.
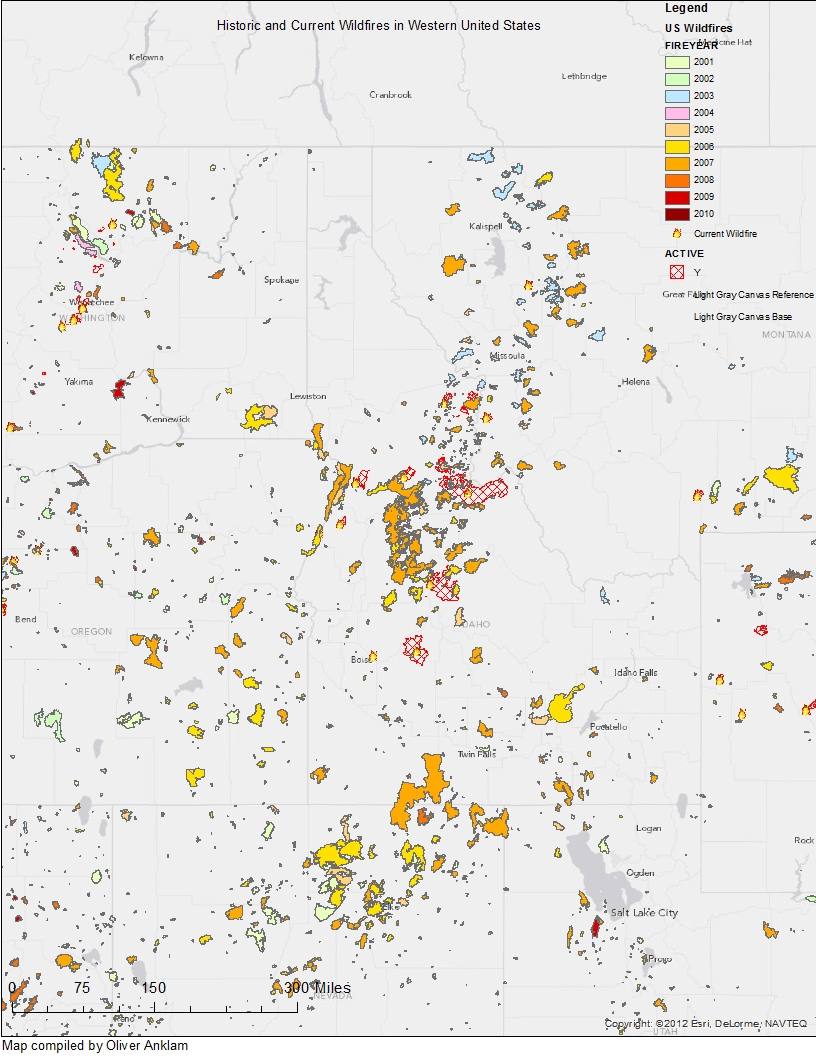
This is a map showing current and historic wildfires in western United States. The paradigm used here is engineering because I have created this map using technology to forecast wildfires that may appear in the future. To make this a complexity based approach, steps must be taken to help prevent wildfires. The "Smokey the Bear" campaign is one example, by reminding us that it is only us who can prevent forest fires.

Data collected from the United States Forest Service, map created using ArcGIS.

Map showing highest crop yield regions in the country. The darkest in central United States is where much food is produced and is also the region most hit by the drought.


This map shows the relationship between building damage density and soil liquification in the Northridge valley in California. The dark blue area shows the highest building damage density. This area also shows higher levels of liquification, as can be seen by the red inside the dark blue. The unsettled soil makes the foundation for these buildings weaker, resulting in more damage resulting from an earthquake.

This map shows the relationship between the stations in the Northridge area and the Peak Ground Velocity. The fastest is marked by the darker blue while the slower is shown with the lighter green. As you can see, more stations are located near areas of higher PGA, which is also near the areas of highest building damage density.

This is a map showing the five most volcanically active countries in the world. There are 1) Indonesia, 2) Japan, 3) United States, 4) Russia, 5) Italy.

This is a model of Mt. Rainier, located south of Seattle in Washington state. Without three dimensions you will have to use your imagination for this one.

This map of Mt. Rainier shows the edges of the mountainside along with the path of lahar flow. As you can see the lahar flow follows the edges directly. The shape of the mountain undoubtedly determine the flow of the lahar.

This map shows a birds eye view of Mt St. Helens before the 1980 eruption.

This is the shot of Mt St. Helens after the 1980 eruption. It almost goes without speaking to point out the giant crater that exists where there once stood a great peak. The entire north face of the mountain was blown away from the blast of the eruption.

This is a map showing the total volume lost from the St Helens eruption. The blach shows the largest amount lost.


This map shows rainfall over an elevated area in California. The heavier amounts of rainfall are indicated by red, lighter is yellow, and lighter yet is green. Lighter regions of the slope map in the middle are indicative of slopes steeper than 30 degrees, which are more prone to landslides. This rainfall can be used to predict landslides in areas experiencing a repose angle above 30 degrees.

This map shows the repose angles above 30 degrees, which is the angle in which landslides occur more frequently. The areas marked by red, yellow, and bright green are most steeply set which makes them more prone to mass wastage.

This map shows the area surrounding the river that would be flooded in the event of a 100 year flood. The yellow is the natural flow of the river and the surrounding white is the area that would be flooded. The flood line in Eau Claire is 780 feet according to FEMA, so this is the water that would go above that mark.

This is a map showing the results of a 100 year flood in Eau Claire, WI if the water were to rise to 790 feet abover sea level. Many of the areas flooded are the same, showing little change with the increased 10 feet.

This is showing the same 100 year flood in Eau Claire, WI if the water level were to rise to 800 feet above sea level. Notice the large amount of area that is affected by this scenario that was not in the previous; mainly the surrounding areas filled in with water.

This map shows the facilities near Oxnard, California that would be at risk from a tsunami. The red dots are the facilities, including schools, medical centers, and emergency centers.

This map shows the water depths that come from hurrican flooding in Collier County, Florida in relation to populated areas. Purple represents the water depth and the black/gray shows the more populated areas. As you can see, the most populated areas are prone to be affected by a significant amount of flooding in the case of a hurricane.

This map shows a 3D image of the Eau Claire University area. The area shown, spotted with black, is the low part of the campus. This area, which contains the majority of the buildings shown, is in a flood basin that, given the right flood, could cause a substantial amount of damge to University buildings.
No comments:
Post a Comment